| 일 | 월 | 화 | 수 | 목 | 금 | 토 |
|---|---|---|---|---|---|---|
| 1 | 2 | 3 | 4 | 5 | 6 | 7 |
| 8 | 9 | 10 | 11 | 12 | 13 | 14 |
| 15 | 16 | 17 | 18 | 19 | 20 | 21 |
| 22 | 23 | 24 | 25 | 26 | 27 | 28 |
- Retry
- login crawling
- API
- airflow subdag
- tensorflow text
- GCP
- Counterfactual Explanations
- XAI
- API Gateway
- flask
- TensorFlow
- GenericGBQException
- integrated gradient
- chatGPT
- youtube data
- Airflow
- 상관관계
- 유튜브 API
- BigQuery
- subdag
- spark udf
- hadoop
- grad-cam
- UDF
- requests
- top_k
- 공분산
- gather_nd
- session 유지
- correlation
- Today
- Total
데이터과학 삼학년
Augmented Dickey-Fuller test - 정상성 시계열 데이터 확인 방법 본문
stationary 한 시계열 데이터인지 아닌지 확인하는 방법들에 대해 알아본다.
-
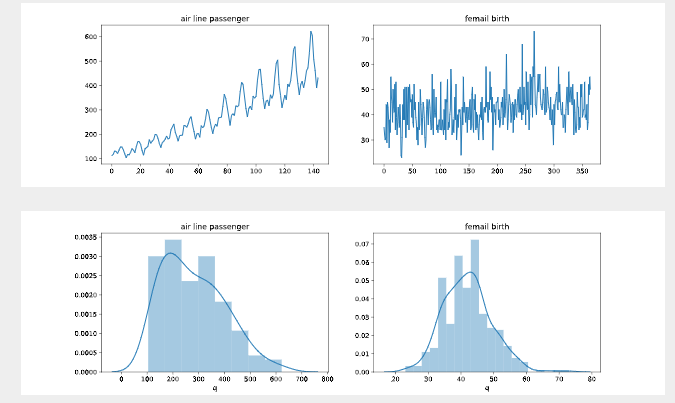
눈으로 보기: 직접 plotting해서 시간에 따라 변하는지 볼 것

-
간단한 평균 내보기: 대략 반으로 쪼개서 앞의 평균과 뒤의 평균이 얼마나 다른지 볼 것
-
statistical test: 통계적 검정하기 --> ADF 검정
검정통계량이(ADF Statistics)가 Critical Value 보다 작으면 stationary 한 시계열 데이터
혹은 P-value가 설정한 신뢰수준 값 (e.g. 0.05) 보다 작은지 큰지 확인하면 된다. 작으면 stationary한 시계열 데이터!
아래 코드를 통한 결과를 보면 female birth데이터가 adf검정값이 critical value보다 작고 p-value가 0.05보다 작으므로 통계적으로 볼때, 정상성(stationary)을 갖는 시계열 데이터라고 판단할 수 있다.
from statsmodels.tsa.stattools import adfuller

def print_adfuller(inputSeries):
    result = adfuller(inputSeries)
    print('ADF Statistic: %f' % result[0])
    print('p-value: %f' % result[1])
    print('Critical Values:')
    for key, value in result[4].items():
        print('\t%s: %.3f' % (key, value))

print_adfuller(df_airline['q'])
print("--------")
print_adfuller(df_female['q'])
print("--------")


==========
ADF Statistic: 0.815369
p-value: 0.991880
Critical Values:
	1%: -3.482
	5%: -2.884
	10%: -2.579
--------
ADF Statistic: -4.808291
p-value: 0.000052
Critical Values:
	1%: -3.449
	5%: -2.870
	10%: -2.571
--------
출처
https://machinelearningmastery.com/time-series-data-stationary-python/
How to Check if Time Series Data is Stationary with Python
Time series is different from more traditional classification and regression predictive modeling problems. The temporal structure adds an order to the observations. This imposed order means that important assumptions about the consistency of those observat
machinelearningmastery.com
https://frhyme.github.io/python-lib/check_stationary-in-time-series/
time series의 stationarity를 체크해봅시다.
time series의 stationarity를 체크해봅시다.
frhyme.github.io
'Time Series Analysis' 카테고리의 다른 글
| Recurrence Plot (feat. pyts - Imaging time series) (0) | 2020.12.18 |
|---|---|
| Prophet for python (feat. fbprophet) (0) | 2020.12.14 |
| 정상성과 차분 (stationarity & differencing) (0) | 2020.11.03 |
| Recurrence plots (시계열 데이터 이미지화 Time-Series Image) (0) | 2020.10.20 |
| Exponential Smoothing (0) | 2020.05.07 |


