250x250
반응형
Notice
Recent Posts
Recent Comments
Link
| 일 | 월 | 화 | 수 | 목 | 금 | 토 |
|---|---|---|---|---|---|---|
| 1 | 2 | 3 | ||||
| 4 | 5 | 6 | 7 | 8 | 9 | 10 |
| 11 | 12 | 13 | 14 | 15 | 16 | 17 |
| 18 | 19 | 20 | 21 | 22 | 23 | 24 |
| 25 | 26 | 27 | 28 | 29 | 30 | 31 |
Tags
- login crawling
- requests
- top_k
- spark udf
- API
- tensorflow text
- youtube data
- Retry
- GCP
- subdag
- XAI
- Airflow
- API Gateway
- airflow subdag
- gather_nd
- grad-cam
- 유튜브 API
- 공분산
- integrated gradient
- flask
- 상관관계
- session 유지
- UDF
- chatGPT
- hadoop
- GenericGBQException
- correlation
- Counterfactual Explanations
- BigQuery
- TensorFlow
Archives
- Today
- Total
데이터과학 삼학년
Plotly 활용한 covid-19 데이터 시각화 본문
반응형
covid-19 데이터를 시각화로 훑어보자
-
기간 : 2020.01.22~2020.03.22
-
data : 공공데이터를 bigquery에 로드하여 분석
-
시각화 툴 : plotly express 를 주로 사용
import numpy as np
import pandas as pd

import chart_studio.plotly as py
import plotly.express as px
import plotly.graph_objects as go

import cufflinks as cf
cf.go_offline(connected=True)

%matplotlib inline
%load_ext google.cloud.bigquery
%%bigquery df
with
data as (
SELECT
  _TABLE_SUFFIX as dt,
  *
FROM
  `data.coronavirus.csse_covid19_*`
WHERE
  _TABLE_SUFFIX BETWEEN '20200122' AND '20200322'

)
SELECT * FROM data
df.head()
Out[3]:
국가별 확진자수
df_nation_confirmed = df.groupby(['Country_Region']).sum()[['Confirmed','Deaths']]
df_nation_confirmed = df_nation_confirmed.reset_index()
df_nation_confirmed.head()
fig = px.bar(df_nation_confirmed, x='Country_Region', y="Confirmed")
fig.show()
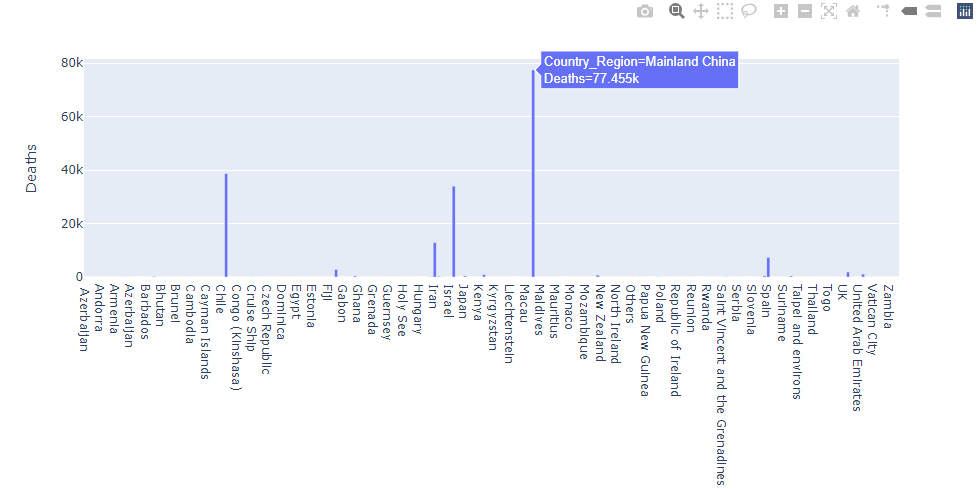
국가별 사망자수
fig = px.bar(df_nation_confirmed, x='Country_Region', y="Deaths")
fig.show()
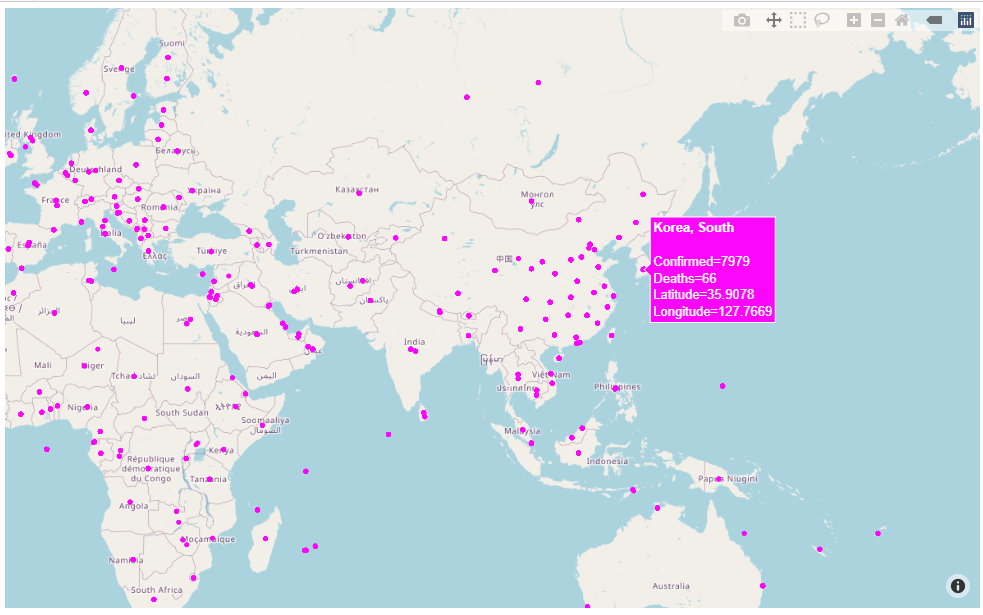
국가별 확진자 수, 사망자수 현황
fig = px.scatter_mapbox(df, lat='Latitude', lon='Longitude', hover_name='Country_Region', hover_data=['Confirmed','Deaths'],
                        color_discrete_sequence=["fuchsia"], zoom=2, height=600)
fig.update_layout(mapbox_style="open-street-map")
fig.update_layout(margin={"r":0,"t":0,"l":0,"b":0})
fig.show()

한국의 확진자 분포 확인
df_korea = df[df.Country_Region=='South Korea']
df_korea.head()
fig = px.box(df_korea, y="Confirmed")
fig.show()

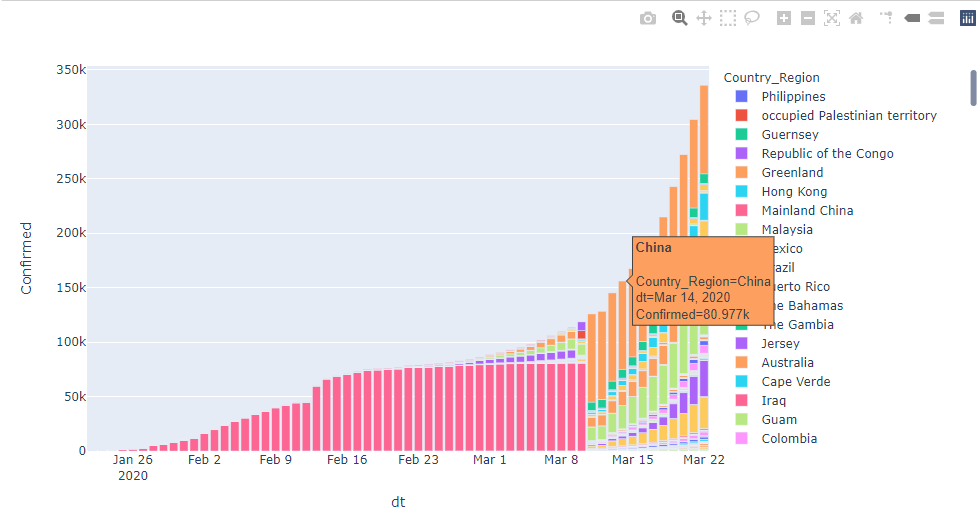
일별 국가별 확진자 수
%%bigquery df_dt
with
data as (
SELECT
  _TABLE_SUFFIX as dt,
  *
FROM
  `data.coronavirus.csse_covid19_*`
WHERE
  _TABLE_SUFFIX BETWEEN '20200122' AND '20200322'

)
SELECT PARSE_DATETIME('%Y%m%d',CAST(dt AS STRING)) AS dt,Country_Region, SUM(Confirmed) as Confirmed, Sum(Deaths) as Deaths
FROM data
GROUP BY dt, Country_Region
ORDER BY Confirmed
df_dt.head()
fig = px.bar(df_dt, x='dt',y="Confirmed",hover_name='Country_Region',color='Country_Region')
fig.show()
bar plot을 이용하면 일별 국가별 누적 확진자처럼 한 날짜에 카테고리별 누적값을 추가할 수 있다.
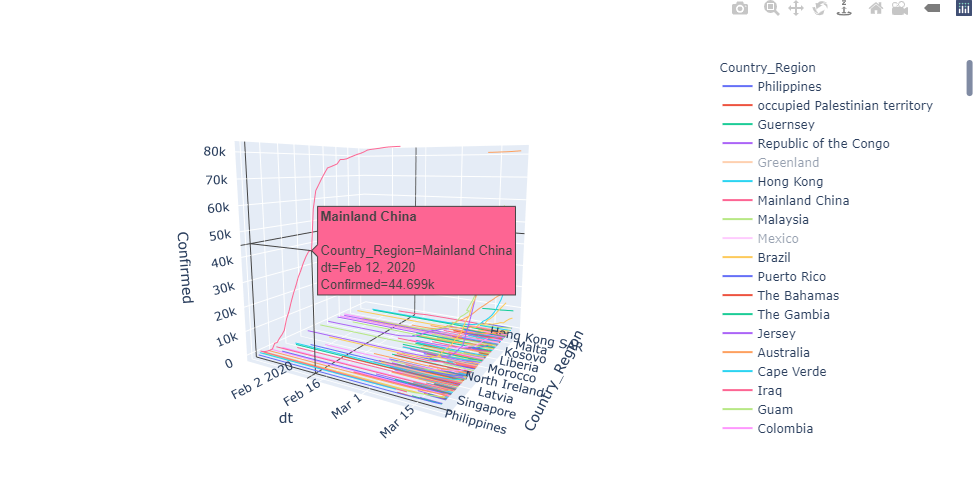
fig = px.line_3d(df_dt, x='dt', y='Country_Region', z="Confirmed",hover_name='Country_Region',color='Country_Region')
fig.show()

728x90
반응형
LIST
'Data Visualization & DataBase' 카테고리의 다른 글
| Fact Table / Dimension Table (0) | 2022.10.23 |
|---|---|
| 효율적이고 쉬운 시각화 ipython interact + plotly (px) (1) | 2020.11.17 |
| Folium 지리 정보 시각화 tool (0) | 2020.06.17 |
| 시계열 데이터 시각화 using plotly (1) | 2020.06.05 |
| Plotly 시각화 툴 (0) | 2020.05.21 |
Comments


