| 일 | 월 | 화 | 수 | 목 | 금 | 토 |
|---|---|---|---|---|---|---|
| 1 | 2 | 3 | ||||
| 4 | 5 | 6 | 7 | 8 | 9 | 10 |
| 11 | 12 | 13 | 14 | 15 | 16 | 17 |
| 18 | 19 | 20 | 21 | 22 | 23 | 24 |
| 25 | 26 | 27 | 28 | 29 | 30 | 31 |
- requests
- TensorFlow
- Counterfactual Explanations
- 상관관계
- XAI
- login crawling
- correlation
- 유튜브 API
- integrated gradient
- hadoop
- BigQuery
- UDF
- API
- top_k
- Retry
- GCP
- API Gateway
- GenericGBQException
- subdag
- chatGPT
- session 유지
- tensorflow text
- youtube data
- flask
- spark udf
- gather_nd
- grad-cam
- airflow subdag
- Airflow
- 공분산
- Today
- Total
데이터과학 삼학년
Plotly 시각화 툴 본문
우연히 시각화 툴을 탐색하다가
아래와 같은 표를 보았다.
matplotlib은 파이썬 입문때 주로 썼고,
bokeh는 web 작업을 하면서 써봤다..
그렇다면 plotly는?

ipython 환경에서 interactive한 시각화 기능을 쓸 수 있다.
자 그럼
먼저 설치는
!pip install chart_studio
!pip install cufflinks
chat_studio 에 plotly 가 들어있다.
import numpy as np
import pandas as pd

import chart_studio.plotly as py
import plotly.express as px
import plotly.graph_objects as go

import cufflinks as cf
cf.go_offline(connected=True)
cf.go_offline 설정으로 connect를 해주면 ipython 내에서 바로 iplot 호출로 figure를 그릴 수 있다.
df_sample['abc'].apply(np.sqrt).iplot(kind='hist')
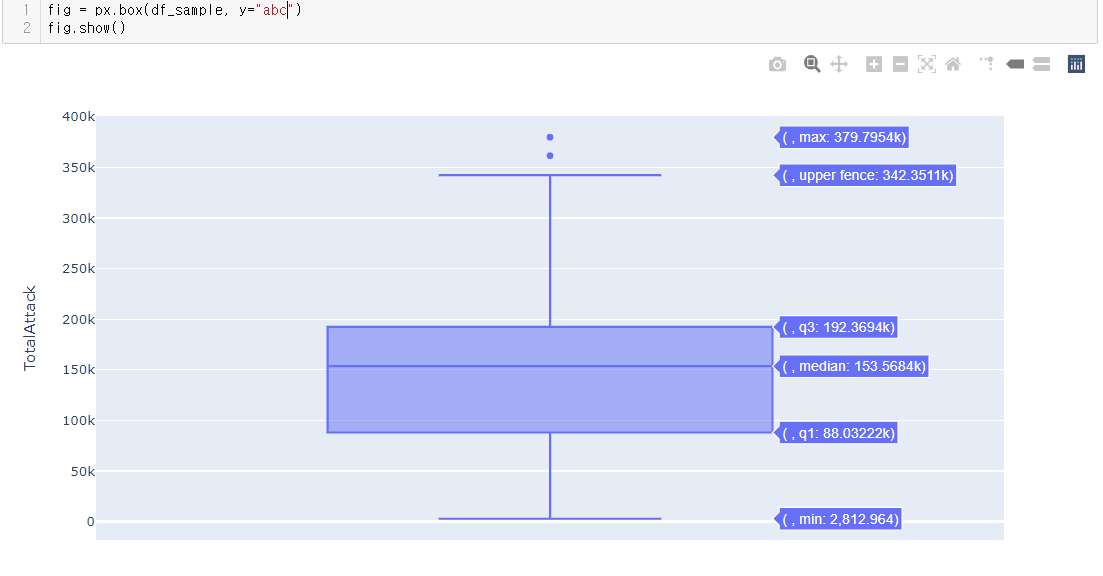
barplot을 그릴때 마우스를 이용해 각 수치를 정확히 확인이 가능하다
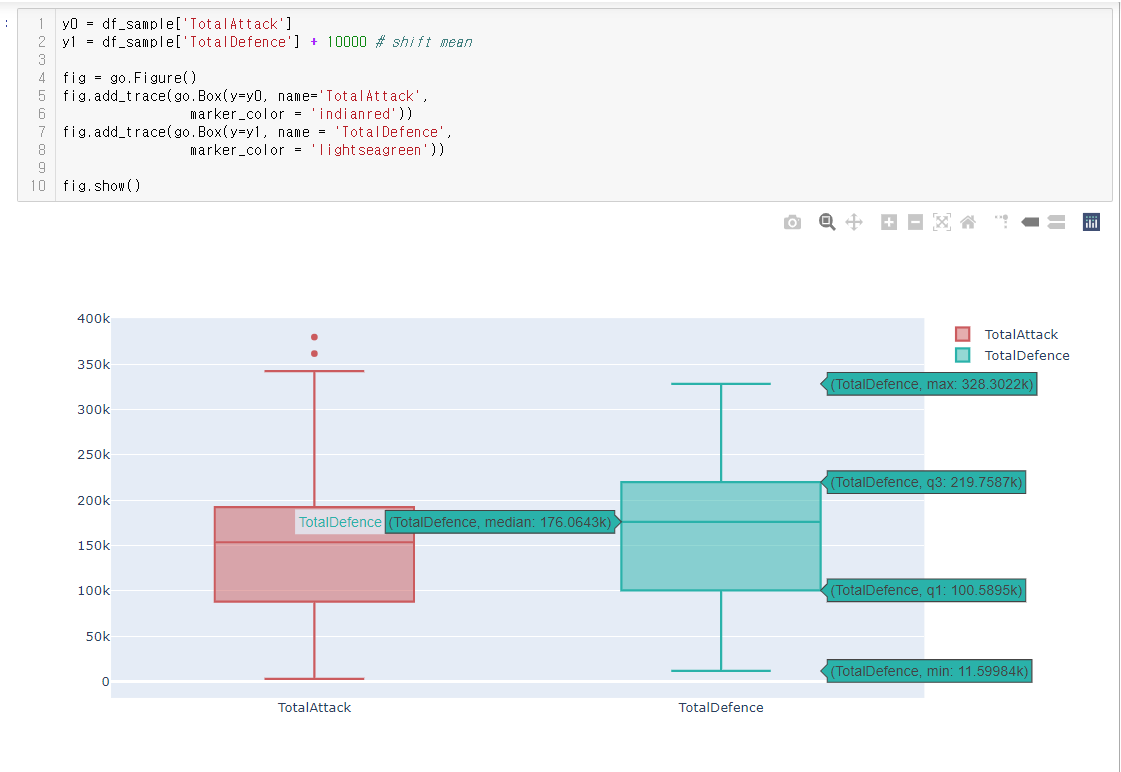
2개 이상의 plot도 문제 없이 고고
다양한 plot 들이 많이 있다.
multi histogram
import plotly.figure_factory as ff
import numpy as np

# Add histogram data
x1 = np.random.randn(200)-2
x2 = np.random.randn(200)
x3 = np.random.randn(200)+2
x4 = np.random.randn(200)+4

# Group data together
hist_data = [x1, x2, x3, x4]

group_labels = ['Group 1', 'Group 2', 'Group 3', 'Group 4']

# Create distplot with custom bin_size
fig = ff.create_distplot(hist_data, group_labels, bin_size=[.1, .25, .5, 1])
fig.show()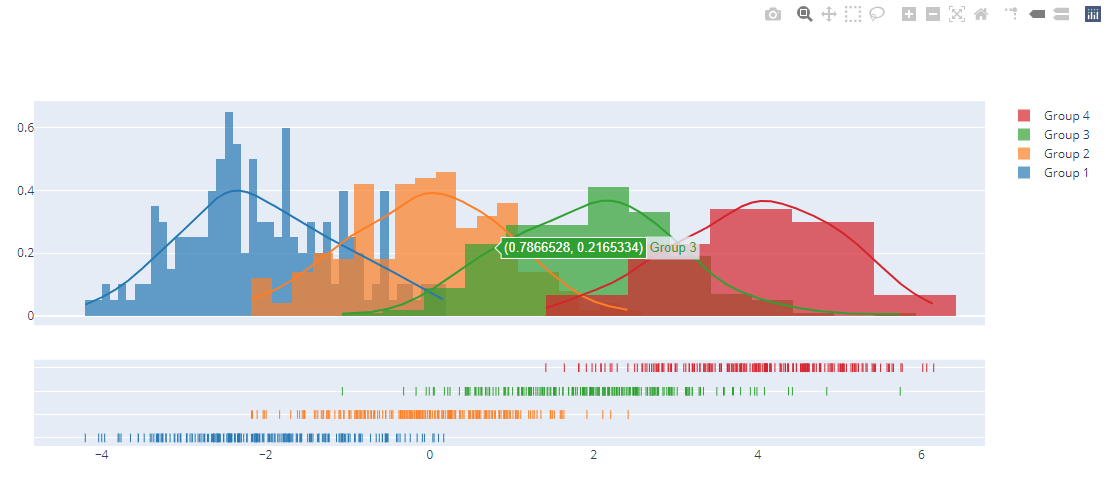
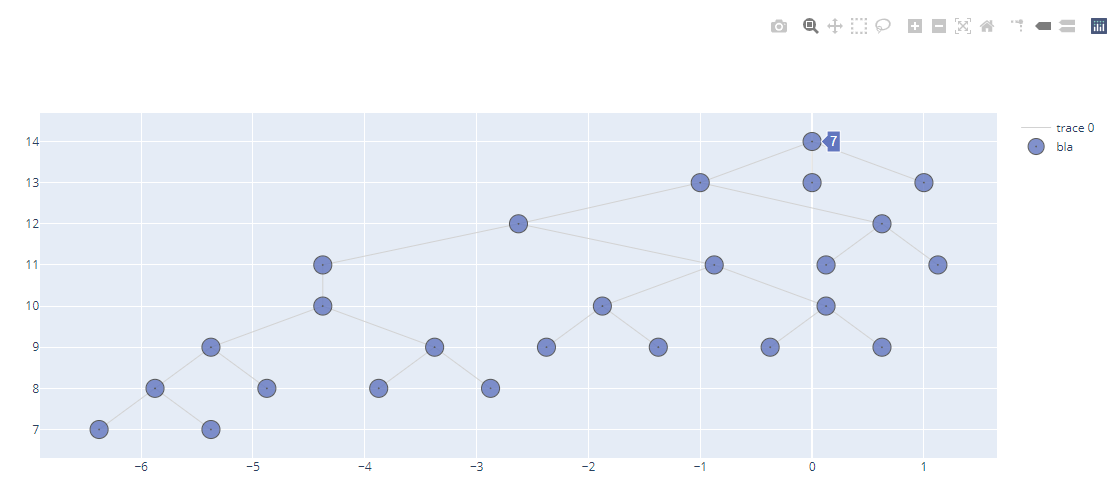
Tree
import plotly.graph_objects as go
fig = go.Figure()
fig.add_trace(go.Scatter(x=Xe,
                   y=Ye,
                   mode='lines',
                   line=dict(color='rgb(210,210,210)', width=1),
                   hoverinfo='none'
                   ))
fig.add_trace(go.Scatter(x=Xn,
                  y=Yn,
                  mode='markers',
                  name='bla',
                  marker=dict(symbol='circle-dot',
                                size=18,
                                color='#6175c1',    #'#DB4551',
                                line=dict(color='rgb(50,50,50)', width=1)
                                ),
                  text=labels,
                  hoverinfo='text',
                  opacity=0.8
                  ))
indicator
import plotly.graph_objects as go

fig = go.Figure()

fig.add_trace(go.Indicator(
    value = 200,
    delta = {'reference': 160},
    gauge = {
        'axis': {'visible': False}},
    domain = {'row': 0, 'column': 0}))

fig.add_trace(go.Indicator(
    value = 120,
    gauge = {
        'shape': "bullet",
        'axis' : {'visible': False}},
    domain = {'x': [0.05, 0.5], 'y': [0.15, 0.35]}))

fig.add_trace(go.Indicator(
    mode = "number+delta",
    value = 300,
    domain = {'row': 0, 'column': 1}))

fig.add_trace(go.Indicator(
    mode = "delta",
    value = 40,
    domain = {'row': 1, 'column': 1}))

fig.update_layout(
    grid = {'rows': 2, 'columns': 2, 'pattern': "independent"},
    template = {'data' : {'indicator': [{
        'title': {'text': "Speed"},
        'mode' : "number+delta+gauge",
        'delta' : {'reference': 90}}]
                         }})

Plotly Python Graphing Library
Plotly's Python graphing library makes interactive, publication-quality graphs. Examples of how to make line plots, scatter plots, area charts, bar charts, error bars, box plots, histograms, heatmaps, subplots, multiple-axes, polar charts, and bubble chart
plotly.com
더 다양한 기능을 찾는 다면 dash를 이용도 가능
https://dash-gallery.plotly.host/Portal/
Dash Enterprise
dash-gallery.plotly.host
'Data Visualization & DataBase' 카테고리의 다른 글
| Folium 지리 정보 시각화 tool (0) | 2020.06.17 |
|---|---|
| 시계열 데이터 시각화 using plotly (1) | 2020.06.05 |
| Bokeh interactive legend (0) | 2020.02.14 |
| Bokeh - Web visualization (0) | 2020.01.17 |
| Ipywidgets을 활용한 시각화 (feat. jupyter notebook) (2) | 2020.01.14 |
