| 일 | 월 | 화 | 수 | 목 | 금 | 토 |
|---|---|---|---|---|---|---|
| 1 | 2 | 3 | ||||
| 4 | 5 | 6 | 7 | 8 | 9 | 10 |
| 11 | 12 | 13 | 14 | 15 | 16 | 17 |
| 18 | 19 | 20 | 21 | 22 | 23 | 24 |
| 25 | 26 | 27 | 28 | 29 | 30 | 31 |
- GCP
- Retry
- BigQuery
- API
- spark udf
- subdag
- XAI
- top_k
- integrated gradient
- TensorFlow
- gather_nd
- 공분산
- youtube data
- login crawling
- grad-cam
- chatGPT
- API Gateway
- requests
- 유튜브 API
- airflow subdag
- Airflow
- flask
- GenericGBQException
- tensorflow text
- session 유지
- 상관관계
- correlation
- hadoop
- Counterfactual Explanations
- UDF
- Today
- Total
데이터과학 삼학년
Ch2. Fancy Tricks with Simple Numbers 본문
숫자를 위한 멋진 트릭
- 숫자 데이터는 이미 수학적 모델로 처리하기 쉬운 형식으로 되어있음
- 좋은 피처를 만들기 위해 변환과정이 필요함
- 데이터의 가장 두드러진 특징을 표현함
- 모델의 가정에 맞춰야함
- 숫자 데이터에 대한 고려사항
- 값의 크기 문제
- 양수 or 음수만 확인하면 되는가?
- 구간을 나누어서 봐야 하는가?
- 피처의 스케일
- 최소, 최대 확인(차이)
- 입력 스케일에 직접적인 영향을 받는 기법 => 정규화 필요
- K-means clustering
- Nearest-neighbor
- RBF(Radial Basis Function) kernel
- Euclidean distance
- 논리 함수는 입력 스케일에 크게 영향받지 않음
- Step function (x > 5?)으로 구성되는 Decision Tree
- Gradient boosted machine
- Random forest
- Space-partitioning tree
- Step function (x > 5?)으로 구성되는 Decision Tree
- 누적횟수가 피처로 사용될 경우 주기적으로 스케일 조정이 필요함
- Bin-counting 기법 이용
- 피처의 분포
- Linear regression에서는 예측 오차(RMSE)가 Gaussian 분포와 같이 나타날 것으로 가정함
- 타겟 변수가 큰 자릿수인 경우 로그 변환등으로 조정해줌
- Linear regression에서는 예측 오차(RMSE)가 Gaussian 분포와 같이 나타날 것으로 가정함
- 여러 피처를 조합하여 더 복잡한 피처를 추가로 구성
- 모델이 단순해질 수 있으며 학습 및 평가가 쉬워질 수 있음
- 값의 크기 문제
스칼라, 벡터, 공간
-
스칼라
-
단일 숫자
-
-
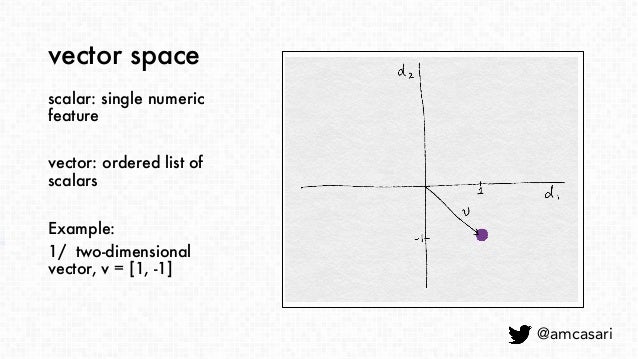
벡터
-
방향이 있는 스칼라의 리스트
-
-
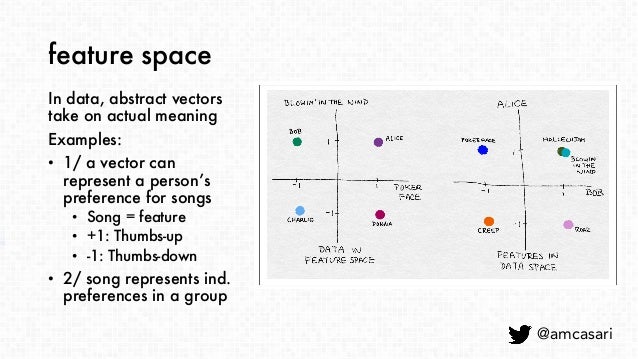
벡터 공간
-
벡터를 정의할 수 있는 영역
-
카운트 처리
- 카운트는 아무 제약 없이 빠르게 누적됨
- 데이터의 스케일을 확인 해야함
- 그대로 사용할 것인지?
- 존재 여부만 나타내는 바이너리로 변환할 것인지?
- 몇개의 구간으로 나눌 것인지?
바이너리 변환
-
데이터셋: Echo Nest Taste Profile Subset: Million Song [Download]
-
Goal: 사용자에게 노래를 추천하는 추천 모델 생성
데이터 탐색
import pandas as pd
# Million Song 데이터셋 경로 & 로드
MSD_Path = r'train_triplets.txt.zip'
listen_count = pd.read_csv(MSD_Path, header=None, delimiter='\t')
# 테이블은 (사용자, 곡, 재생 카운트)로 구성됨
listen_count.head(5)
# 레코드 수: 48,373,586개
listen_count.shape[0]
# 사용자 수: 1,019,318명
listen_count[0].unique().shape[0]
# 곡 수: 384,546개
listen_count[1].unique().shape[0]
import matplotlib.pyplot as plt
import seaborn as sns
# 재생 카운트에 대한 히스토그램
sns.set_style('whitegrid')
fig, ax = plt.subplots()
listen_count[2].hist(ax=ax, bins=100)
ax.set_yscale('log')
ax.tick_params(labelsize=14)
ax.set_xlabel('Play Count', fontsize=14)
ax.set_ylabel('Occurrence', fontsize=14)
# 재생 카운트의 최소, 최대, 평균
(listen_count[2].min(), listen_count[2].max(), round(listen_count[2].mean(), 2))
- 재생 카운트의 99%가 24회 이하임
- 노래를 두 배 많이 듣는 것이 노래를 두 배 더 좋아하는 것은 아님
- 따라서 노래를 한 번 이상 들었으면 좋아한다고 가정
Example 2-1. Million Song 데이터셋의 재생 카운트 바이너리 변환
listen_count[2] = 1
listen_count.head(5)
양자화 또는 비닝
- 데이터셋: Yelp 데이터셋 챌린지 [Download]
- Goal: 사용자가 한 비즈니스에 줄 것으로 예상되는 등급을 예측
데이터탐색
Example 2-2. Yelp 데이터셋의 비즈니스 리뷰 카운트에 대한 시각화
import pandas as pd
import json
# Yelp 데이터셋 경로 & 로드
Yelp_Path = r'D:\공부\Study\Feature_Engineering\dataset\yelp_dataset-2\business.json'
biz_file = open(Yelp_Path, encoding='utf-8') # windows 인코딩 default: cp949
biz_df = pd.DataFrame([json.loads(x) for x in biz_file.readlines()])
biz_file.close()
# 레코드와 컬럼 수
# 비즈니스의 수가 round6에 비해 약 3배 증가함 (현재 round 13)
biz_df.shape
# 컬럼 내용
biz_df.columns
# 비즈니스 카테고리 수: 1,300개
category_set = set()
for x in biz_df['categories']:
    try: # None이 있음
        for y in x.split(','):
            category_set.add(y.strip())
    except:
        continue
len(category_set)
# 'Restaurants'와 'Nightlife' 카테고리를 함께 가진 비즈니스의 수: 8,562개
biz_df[(biz_df['categories'].str.contains('Restaurants') == True) & (biz_df['categories'].str.contains('Nightlife') == True)].shape[0]
# 총 리뷰 카운트 수: 6,459,906개
biz_df['review_count'].sum(axis=0) # axis=0: 행방향 (열의 합)
# 리뷰 카운트에 대한 히스토그램
sns.set_style('whitegrid')
fig, ax = plt.subplots()
biz_df['review_count'].hist(ax=ax, bins=100)
ax.set_yscale('log')
ax.tick_params(labelsize=14)
ax.set_xlabel('Review Count', fontsize=14)
ax.set_ylabel('Occurrence', fontsize=14)
- 대부분의 카운트 값은 작지만 일부 비즈니스는 수천 개 이상의 리뷰를 보임
- 여러 자릿수에 걸쳐 폭넓게 펼쳐져 있는 원시 카운트 값은 많은 모델에서 문제가 됨
- 특히, 유클리드 거리를 사용하는 k-means clustering과 같은 unsupervised learning 기법에서 많은 문제가 됨
- 데이터 벡터에서 큰 값을 갖는 요소는 유사도 측정 시 영향력이 큼 --> 왜곡 될 수 있음
- 한 가지 해결책으로 카운트를 양자화하여 빈으로 그룹화
고정 폭 비닝
- 각 빈은 특정 범위의 수를 포함함
- 사용자 정의 / 선형 스케일 / 지수 스케일 등으로 설정 가능
- 여러 자릿수에 걸쳐 있는 데이터
- 10의 거듭제곱으로 그룹을 나누는 것이 좋음
Example 2-3. 고정 폭 빈으로 카운트 양자화
import numpy as np
# 0 ~ 99 사이에서 균일하게 20개의 무작위 정수 생성
small_counts = np.random.randint(0, 100, 20)
small_counts
# 10으로 나누기를 해서 동일한 구간을 갖는 빈 0 ~ 9에 매핑
np.floor_divide(small_counts, 10)
# 여러 자릿수에 걸쳐 있는 카운트의 배열
large_counts = [296, 8286, 64011, 80, 3, 725, 867, 2215, 7689, 11495, 91897, 44, 28, 7971, 926, 122, 22222]
# 로그 함수를 통해 지수 폭 빈에 매핑
np.floor(np.log10(large_counts))
분위수 비닝
- 카운트 사이에 큰 갭이 있다면 데이터가 없이 존재하는 빈이 생길 수 있음
- 데이터의 분포를 기초로 빈을 유동적으로 배치하여 해결 가능
- 분포의 분위수를 이용하면 됨
Example 2-4. Yelp 비즈니스 리뷰 카운트에 대한 십분위수 계산
deciles = biz_df['review_count'].quantile([.1, .2, .3, .4, .5, .6, .7, .8, .9, 1.0])
deciles
# 히스토그램으로 시각화
sns.set_style('whitegrid')
fig, ax = plt.subplots()
biz_df['review_count'].hist(ax=ax, bins=100)
for pos in deciles:
    handle = plt.axvline(pos, color='r')
ax.legend([handle], ['deciles'], fontsize=14)
ax.set_yscale('log')
ax.set_xscale('log')
ax.tick_params(labelsize=14)
ax.set_xlabel('Review Count', fontsize=14)
ax.set_ylabel('Occurence', fontsize=14)
Example 2-5. 분위수를 사용한 카운트 비닝
# 예제 2-3의 large_counts를 사용함
import pandas as pd
large_counts = [296, 8286, 64011, 80, 3, 725, 867, 2215, 7689, 11495, 91897, 44, 28, 7971, 926, 122, 22222]
# 카운트를 사분위수와 매핑
# 데이터가 어느 분위수에 들어가는지를 반환해줌
pd.qcut(large_counts, 4, labels=False)
# 분위수 계산
large_counts_series = pd.Series(large_counts)
large_counts_series.quantile([0.25, 0.5, 0.75, 1.0])
x = np.arange(1, 1000)
y = np.log10(x)
plt.plot(x, y, 'r')
plt.tick_params(labelsize=14)
plt.xlabel('x', fontsize=14)
plt.ylabel('log10(x)', fontsize=14)
- 분포에서 값이 높은 쪽에 있는 긴 꼬리를 짧게 압축하며, 낮은 값 쪽의 머리가 길어지게 함
Example 2-6. 리뷰 카운트에 대한 로그 변환 전과 후의 분포 시각화
# 리뷰 카운트에 대한 로그 변환
biz_df['log_review_count'] = np.log10(biz_df['review_count'] + 1)

fig, (ax1, ax2) = plt.subplots(2, 1, figsize=(10, 12))
# 로그 변환 이전
biz_df['review_count'].hist(ax=ax1, bins=100)
ax1.tick_params(labelsize=14)
ax1.set_xlabel('Review Count', fontsize=14)
ax1.set_ylabel('Occurrence', fontsize=14)
# 로그 변환 이후
biz_df['log_review_count'].hist(ax=ax2, bins=100)
ax2.tick_params(labelsize=14)
ax2.set_xlabel('log10(Review Count)', fontsize=14)
ax2.set_ylabel('Occurrence', fontsize=14)
- 로그 변환을 통해 값이 낮은 쪽에 집중되는 현상이 줄어들었고 x축 방향으로 좀 더 펼쳐지게 됨
Example 2-7. 뉴스 기사 인기도에 대한 로그 변환 이전과 이후 분포의 시각화
- 데이터셋: Online News Popularity [Downloads]
- Goal: 소셜 미디어에 공유된 수를 기준으로 기사의 인기도를 예측
# Online News Popularity 데이터셋 경로 및 로드
ONP_Path = r'D:\공부\Study\Feature_Engineering\dataset\OnlineNewsPopularity\OnlineNewsPopularity.csv'
# ONP_df = pd.read_csv(ONP_Path) # 컬럼에 whitespace가 들어가있음
ONP_df = pd.read_csv(ONP_Path, sep='\s*,\s*', engine='python') # 정규표현식에서 '\s': whitespace 문자와 매치, '*': 반복
# 레코드 및 컬럼 수
ONP_df.shape
# 데이터 확인
ONP_df.head(3)
# 컬럼 확인
ONP_df.columns
# 예제 2-7에서는 "기사 단어 수" 피처 하나에만 초점을 둠
# 기사 단어 수 로그 변환
ONP_df['log_n_tokens_content'] = np.log10(ONP_df['n_tokens_content'] + 1)

fig, (ax1, ax2) = plt.subplots(2, 1, figsize=(12, 10))
# 로그 변환 이전
ONP_df['n_tokens_content'].hist(ax=ax1, bins=100)
ax1.tick_params(labelsize=14)
ax1.set_xlabel('Number of Words in Article', fontsize=14)
ax1.set_ylabel('Number of Articles', fontsize=14)
# 로그 변환 이후
ONP_df['log_n_tokens_content'].hist(ax=ax2, bins=100)
ax2.tick_params(labelsize=14)
ax2.set_xlabel('log10(Number of Words in Article)', fontsize=14)
ax2.set_ylabel('Number of Articles', fontsize=14)
- 로그 변환 이후의 분포가 훨씬 더 가우시안 분포와 비슷함
로그 변환의 역할
Example 2-8. 로그 변환된 Yelp 리뷰 카운트를 사용해 비즈니스의 평균 등급 예측
- 로그 변환 이전과 이후의 피처를 가지고 선형 회귀 모델에 대한 10등분 교차 검증을 수행함
- 모델은 $R^2$ 점수로 평가함
- 학습된 회귀 모델이 새로운 데이터에 대해 얼마나 잘 예측하는지를 나타냄
- 좋은 모델은 $R^2$ 점수가 높음 (최대 1)
import pandas as pd
import numpy as np
import json
from sklearn import linear_model
from sklearn.model_selection import cross_val_score
# Yelp 데이터셋 경로 & 로드
Yelp_Path = r'D:\공부\Study\Feature_Engineering\dataset\yelp_dataset-2\business.json'
biz_file = open(Yelp_Path, encoding='utf-8') # windows 인코딩 default: cp949
biz_df = pd.DataFrame([json.loads(x) for x in biz_file.readlines()])
biz_file.close()
# 로그화를 위해 원 리뷰 카운트에 +1을 함
biz_df['log_review_count'] = np.log10(biz_df['review_count'] + 1)
# 10-fold cross validation을  통해 R^2 점수 비교
m_orig = linear_model.LinearRegression()
scores_orig = cross_val_score(m_orig, biz_df[['review_count']], biz_df['stars'], cv=10)
m_log = linear_model.LinearRegression()
scores_log = cross_val_score(m_log, biz_df[['log_review_count']], biz_df['stars'], cv=10)

print("R-squared score without log transform: %0.5f (+/- %0.5f)" % (scores_orig.mean(), scores_orig.std() * 2))
print("R-squared score with log transform: %0.5f (+/- %0.5f)" % (scores_log.mean(), scores_log.std() * 2))
- 로그 변환된 피처의 성능이 더 좋음
Example 2-9. Online News Popularity 데이터셋에서 로그 변환된 단어 수를 사용해 기사의 인기도를 예측
# Online News Popularity 데이터셋 경로 및 로드
ONP_Path = r'D:\공부\Study\Feature_Engineering\dataset\OnlineNewsPopularity\OnlineNewsPopularity.csv'
df = pd.read_csv(ONP_Path, sep='\s*,\s*', engine='python') # 정규표현식에서 '\s': whitespace 문자와 매치, '*': 반복
# 뉴스 기사의 단어(토큰) 수를 나타내는 'n_tokens_content' 피처를 로그화함
df['log_n_tokens_content'] = np.log10(df['n_tokens_content'] + 1)
# 한 모델은 원래 피처, 다른 모델은 로그화된 피처를 사용하여 선형 회귀 모델을 사용함
m_orig = linear_model.LinearRegression()
scores_orig = cross_val_score(m_orig, df[['n_tokens_content']], df['shares'], cv=10)
m_log = linear_model.LinearRegression()
scores_log = cross_val_score(m_log, df[['log_n_tokens_content']], df['shares'], cv=10)

print("R-squared score without log transform: %0.5f (+/- %0.5f)" % (scores_orig.mean(), scores_orig.std() * 2))
print("R-squared score with log transform: %0.5f (+/- %0.5f)" % (scores_log.mean(), scores_log.std() * 2))
- 로그 변환된 피처의 성능이 더 좋음
Example 2-10. 뉴스 인기도 예측 문제에서 입력과 출력 사이의 상관관계 시각화
fig2, (ax1, ax2) = plt.subplots(2, 1, figsize=(12, 10))
ax1.scatter(df['n_tokens_content'],df['shares'])
ax1.tick_params(labelsize=14)
ax1.set_xlabel('Number of Words in Article', fontsize=14)
ax1.set_ylabel('Number of Shares', fontsize=14)

ax2.scatter(df['log_n_tokens_content'],df['shares'])
ax2.tick_params(labelsize=14)
ax2.set_xlabel('Number of Words in Article', fontsize=14)
ax2.set_ylabel('Number of Shares', fontsize=14)
- 로그 변환을 하지 않으면 모델은 입력 피처의 매우 작은 변화에 영향을 많이 받으며 다른 목표 변수에 피팅됨
Example 2-11. Yelp 비즈니스 리뷰 예측에서 입력 및 출력 간의 상관관계 시각화
fig, (ax1, ax2) = plt.subplots(2, 1, figsize=(12, 10))
ax1.scatter(biz_df['review_count'],biz_df['stars'])
ax1.tick_params(labelsize=14)
ax1.set_xlabel('Review Count', fontsize=14)
ax1.set_ylabel('Average Star Rating', fontsize=14)

ax2.scatter(biz_df['log_review_count'],biz_df['stars'])
ax2.tick_params(labelsize=14)
ax2.set_xlabel('Log of Review Count', fontsize=14)
ax2.set_ylabel('Average Star Rating', fontsize=14)
- 평균 별점 등급은 이산 변수로 리뷰 카운트와 선형 관계는 아님
- 평균 별점을 예측하는데 리뷰 카운트와 로그화된 리뷰 카운트 모두 좋은 피처가 아님
거듭제곱 변환: 로그 변환의 일반화
- 로그 변환은 통계 용어로 분산 안정화 변환(Variance-stabilizing transformation)이라고 함
- 분산이 작아지는 것을 분산이 안정화된다고 함
- 제곱근 변환과 로그 변환의 일반화를 Box-Cox 변환이라고 함
- $\tilde x$ $=$ $\begin{cases} \frac{x^\lambda - 1}{\lambda}, & \text{if }\lambda\ne0 \\ \text{ln}(x), & \text{if }\lambda=0 \end{cases}$
- $\lambda=0$(로그 변환)
- 데이터가 양수일 때만 동작함
- 파라미터 $\lambda$는 최대 우도법이나 베이지안 기법을 통해 가우시안 확률이 최대화되는 값으로 얻을 수 있음
- scipy의 stats 패키지에서 Box-Cox 변환에 대한 구현을 제공하고 있음
x = np.arange(0.001, 3, 0.01)
lambda0 = np.log(x)
one_quarter = (x**0.25 - 1)/0.25
square_root = (x**0.5 - 1)/0.5
three_quarters = (x**0.75 - 1)/0.75
one_point_five = (x**1.5 - 1)/1.5

# 여러 람다 값에 대한 Box-Cox 변환 그래프
fig, ax = plt.subplots(figsize=(10, 7))
plt.plot(x, lambda0, 'c',
         x, one_quarter, 'r--',
         x, square_root, 'g-.',
         x, three_quarters, 'b:',
         x, one_point_five, 'k')
plt.legend(['lambda = 0', 'lambda = 0.25', 'lambda = 0.5', 'lambda = 0.75', 'lambda = 1.5'],
           loc='lower right',
           prop={'size': 14})
ax.tick_params(labelsize=14)
ax.set_xlim([0.0,3.0])
ax.set_xlabel('x', fontsize=14)
ax.set_ylabel('y', fontsize=14)
ax.set_title('Box-Cox Transforms', fontsize=14)
Example 2-12. Yelp 비즈니스 리뷰 카운트에 대한 Box-Cox 변환
from scipy import stats
# Box-Cox 변환은 입력 데이터가 양수라고 가정함
biz_df['review_count'].min()
# lambda = 0: 로그 변환
biz_df['rc_log'] = stats.boxcox(biz_df['review_count'], lmbda=0)
# 기본적으로 Box-Cox 변환의 Scipy 구현은 출력을 정규분포에 가장 가깝게 만드는 람다를 찾아줌
biz_df['rc_bc'], bc_params = stats.boxcox(biz_df['review_count'])
bc_params
Example 2-13. 원본, 로그 변환된 리뷰 카운트, Box-Cox 변환된 리뷰 카운트의 히스토그램 비교
fig, (ax1, ax2, ax3) = plt.subplots(3, 1, figsize=(12, 15))
# 원본 리뷰 카운트 히스토그램
biz_df['review_count'].hist(ax=ax1, bins=100)
ax1.set_yscale('log')
ax1.tick_params(labelsize=14)
ax1.set_title('Review Counts Histogram', fontsize=14)
ax1.set_xlabel('')
ax1.set_ylabel('Occurrence', fontsize=14)
# 로그 변환된 리뷰 카운트 히스토그램
biz_df['rc_log'].hist(ax=ax2, bins=100)
ax2.set_yscale('log')
ax2.tick_params(labelsize=14)
ax2.set_title('Log Transformed Counts Histogram', fontsize=14)
ax2.set_xlabel('')
ax2.set_ylabel('Occurrence', fontsize=14)
# Box-Cox 변환된 리뷰 카운트 히스토그램
biz_df['rc_bc'].hist(ax=ax3, bins=100)
ax3.set_yscale('log')
ax3.tick_params(labelsize=14)
ax3.set_title('Box-Cox Transformed Counts Histogram', fontsize=14)
ax3.set_xlabel('')
ax3.set_ylabel('Occurrence', fontsize=14)
Example 2-14. 원본 및 변환된 카운트의 정규분포에 대한 확률 플롯
fig2, (ax1, ax2, ax3) = plt.subplots(3, 1, figsize=(12, 15))
prob1 = stats.probplot(biz_df['review_count'], dist=stats.norm, plot=ax1)
ax1.set_xlabel('')
ax1.set_title('Probplot against normal distribution')

prob2 = stats.probplot(biz_df['rc_log'], dist=stats.norm, plot=ax2)
ax2.set_xlabel('')
ax2.set_title('Probplot after log transform')

prob3 = stats.probplot(biz_df['rc_bc'], dist=stats.norm, plot=ax3)
ax3.set_xlabel('')
ax3.set_title('Probplot after Box-Cox transform')
- 관측된 데이터는 전부 양수이고 가우시안은 음수일 수 있기 때문에 분위수가 음의 영역 끝에서는 잘 안맞을 수 있음
- 첫 번째 그래프에서 원래의 리뷰 카운트는 정규분포보다 훨씬 더 두꺼운 꼬리를 갖고 있음
- 로그 변환은 양수 쪽 꼬리가 정규분포에 가까워 졌음
- Box-Cox 변환은 로그 변환보다 꼬리를 수축시킴
- 입력에 대한 평활 함수인 모델은 입력의 스케일에 영향을 받음
- 트리 기반 모델은 입력의 스케일을 크게 신경쓰지 않아도 됨
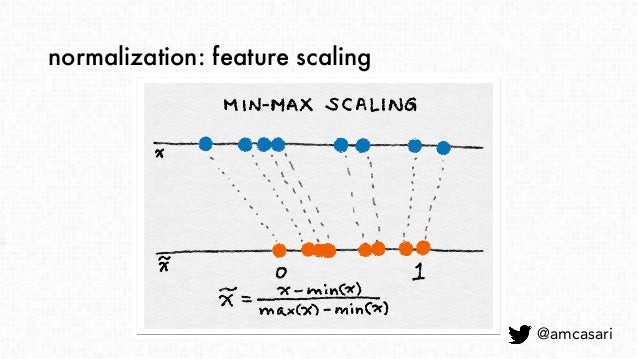
min-max 스케일링
- $\tilde x$ = $x - min(x) \over max(x) - min(x)$
- 피처의 값을 $[0, 1]$로 압축하거나 확장함
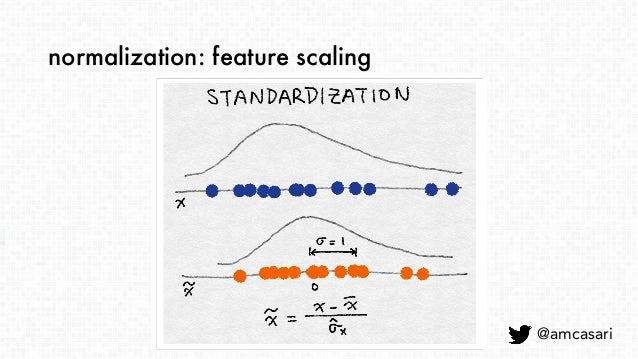
표준화(분산 스케일링)
- $\tilde x$ = $x - mean(x) \over sqrt(var(x))$
- 평균이 0이고 분산이 1이 됨
- 원본 피처가 가우시안 분포인 경우 스케일링된 피처도 가우시안 분포를 갖음
- 희소 데이터는 센터화 하지 말 것!!
- 대부분의 값이 0인 희소 피처 벡터를 조밀하게 바꿀 수 있음
- 분류기에 엄청난 계산 부담을 줄 수 있음
$l^2$정규화
- $\tilde x$ = $x \over \lVert x \rVert_2$
- $\lVert x \rVert_2 = \sqrt{x_1^2 + x_2^2 + \ldots + x_m^2}$
- 유클리드 노름이라고도 함
- 좌표 공간에서 벡터의 길이를 측정함
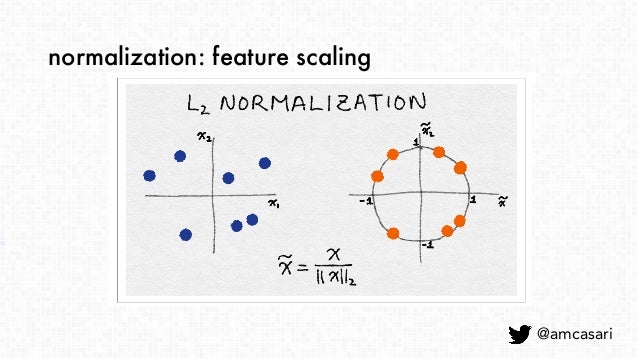
- 좌표 공간에서 벡터의 길이를 측정함
Example 2-15. 피처 스케일링 예제
import pandas as pd
import sklearn.preprocessing as preproc
# Online News Popularity 데이터셋 경로 및 로드
ONP_Path = r'D:\공부\Study\Feature_Engineering\dataset\OnlineNewsPopularity\OnlineNewsPopularity.csv'
df = pd.read_csv(ONP_Path, sep='\s*,\s*', engine='python') # 정규표현식에서 '\s': whitespace 문자와 매치, '*': 반복
# 원본 데이터 확인 - 기사의 단어 수
df['n_tokens_content'].values # .as_matrix() 는 곧 사라질 method이므로 .values를 사용할 것
# min-max 스케일링
df['minmax'] = preproc.minmax_scale(df[['n_tokens_content']])
df['minmax'].values
# 표준화 - 정의에 따라 일부 값은 음수가 될 수 있음
df['standardized'] = preproc.StandardScaler().fit_transform(df[['n_tokens_content']])
df['standardized'].values
# L2 정규화
df['l2_normalized'] = preproc.normalize(df[['n_tokens_content']], axis=0)
df['l2_normalized'].values
Example 2-16. 원본 및 스케일링된 데이터의 히스토그램 비교
fig, (ax1, ax2, ax3, ax4) = plt.subplots(4, 1, figsize=(8, 7))
fig.tight_layout(h_pad=2.0)

df['n_tokens_content'].hist(ax=ax1, bins=100)
ax1.tick_params(labelsize=14)
ax1.set_xlabel('Article Word Count', fontsize=14)
ax1.set_ylabel('Number of Articles', fontsize=14)

df['minmax'].hist(ax=ax2, bins=100)
ax2.tick_params(labelsize=14)
ax2.set_xlabel('Min-max scaled Word Count', fontsize=14)
ax2.set_ylabel('Number of Articles', fontsize=14)

df['standardized'].hist(ax=ax3, bins=100)
ax3.tick_params(labelsize=14)
ax3.set_xlabel('Standardized Word Count', fontsize=14)
ax3.set_ylabel('Number of Articles', fontsize=14)

df['l2_normalized'].hist(ax=ax4, bins=100)
ax4.tick_params(labelsize=14)
ax4.set_xlabel('L2-normalized Word Count', fontsize=14)
ax4.set_ylabel('Number of Articles', fontsize=14)
- 스케일링으로 피처의 분포는 바뀌지 않음
- 입력 피처들의 스케일이 서로 크게 다른 경우에는 피처를 표준화하는 것이 좋음
- 간단한 상호작용 피처로 곱이 있음 (AND 연산에 비유 가능)
- GLM(Generalized Linear Model)에서는 상호작용 피처가 매우 유용함
- 일반적으로 선형 결합을 사용함 $(y = w_1x_1 + w_2x_2 + \ldots + w_nx_n)$
- 확장하기 쉬운 방법은 쌍별 조합을 이용하는 것
Example 2-17. 상호작용 피처를 사용한 예측의 예
from sklearn import linear_model
from sklearn.model_selection import train_test_split
import sklearn.preprocessing as preproc
# ONP 데이터셋의 컬럼
df.columns # 'minmax', 'standardized', 'l2_normalized': 예제 2-15에서 생성함
# 콘텐츠 기반 피처만 선택
features = ['n_tokens_title', 'n_tokens_content', 'n_unique_tokens', 'n_non_stop_words', 'n_non_stop_unique_tokens', 'num_hrefs', 'num_self_hrefs', 'num_imgs', 'num_videos',
            'average_token_length', 'num_keywords', 'data_channel_is_lifestyle', 'data_channel_is_entertainment', 'data_channel_is_bus', 'data_channel_is_socmed',
            'data_channel_is_tech', 'data_channel_is_world']
X = df[features]
y = df[['shares']]
# Pairwise 조합을 이용한 상호작용 피처 생성, bias는 무시
X2 = preproc.PolynomialFeatures(include_bias=False).fit_transform(X)
X2.shape
# 두 개의 피처 집합을 모두 train/test 셋으로 분할
X1_train, X1_test, X2_train, X2_test, y_train, y_test = train_test_split(X, X2, y, test_size=0.3, random_state=123)
# 선형 회귀 모델을 training set으로 학습시키고 test set에 대한 점수 산출
def evaluate_feature(X_train, X_test, y_train, y_test):
    model = linear_model.LinearRegression().fit(X_train, y_train)
    r_score = model.score(X_test, y_test)
    return (model, r_score)
# 두 피처 집합에 대해 모델을 학습시키고 점수 비교
(m1, r1) = evaluate_feature(X1_train, X1_test, y_train, y_test)
(m2, r2) = evaluate_feature(X2_train, X2_test, y_train, y_test)
print("R-squared score with singleton features: %0.5f" % r1)
print("R-squared score with pairwise features: %0.10f" % r2)
- 상호작용 피처는 만들기 쉽지만 사용할 때 비용이 많이 들어감
- 선형 모델의 학습 시간이 $O(n)$에서 $O(n^2)$까지 증가할 수 있음, $n$은 개별 피처의 수
- 해결 방안으로 피처에 우선순위를 매겨서 선택하거나 수작업으로 몇가지의 복합 피처를 만드는 것이 있음
- 피처 선택 기법은 모델의 복잡성을 줄이기 위해 불필요한 피처를 제거함
- 최종 목표는 예측 정확도를 거의 저하시키지 않으면서 계산이 빠른 간결한 모델을 만드는 것
필터링
- 피처를 전처리하여 모델에 유용하지 않을 것 같은 피처를 제거하는 것
- 피처와 목표 변수 간의 상관관계 또는 상호 정보량을 계산하여 필터링함
- 래퍼 메소드 보다 비용이 적게 들지만 적용될 모델을 고려하지 않음
- 필터링은 보수적으로 진행하는 것이 좋음
래퍼 메소드
- 피처의 하위 집합을 테스트할 수 있도록 해줌
- 정보가 적은 피처라도 조합을 통해 유용할 수 있는 것들을 실수로 제거하지 않을 수 있음
- 모델을 제안된 피처 서브셋의 품질 점수를 내주는 블랙박스로 취급함
내장 메소드
- 모델 학습 과정의 일부로서 피처 선택을 수행함
- 의사 결정 트리
- 모델에 적합한 피처를 선택함
from IPython.core.display import display, HTML
display(HTML("<style>.container{width:90%!important;}</style>"))
'Feature Engineering' 카테고리의 다른 글
| Ch.6 Dimensionality Reduction: Squashing the Data Pancake with PCA (0) | 2020.05.06 |
|---|---|
| Ch.5 Categorical Variables: Counting Eggs in theAge of Robotic Chickens (0) | 2020.04.14 |
| Ch4. The Effects of Feature Scaling: From Bag-of-Words to Tf-Idf (1) | 2020.04.02 |
| Ch3. Text Data: Flattening, Filtering,and Chunking (0) | 2020.03.27 |
| Ch1. The Machine Learning Pipeline (0) | 2020.03.27 |

