
250x250
반응형
Notice
Recent Posts
Recent Comments
Link
| 일 | 월 | 화 | 수 | 목 | 금 | 토 |
|---|---|---|---|---|---|---|
| 1 | 2 | 3 | 4 | |||
| 5 | 6 | 7 | 8 | 9 | 10 | 11 |
| 12 | 13 | 14 | 15 | 16 | 17 | 18 |
| 19 | 20 | 21 | 22 | 23 | 24 | 25 |
| 26 | 27 | 28 | 29 | 30 | 31 |
Tags
- 유튜브 API
- top_k
- Airflow
- integrated gradient
- airflow subdag
- 공분산
- UDF
- GCP
- XAI
- subdag
- API
- youtube data
- session 유지
- login crawling
- flask
- API Gateway
- gather_nd
- Counterfactual Explanations
- hadoop
- spark udf
- chatGPT
- tensorflow text
- 상관관계
- Retry
- correlation
- BigQuery
- grad-cam
- requests
- TensorFlow
- GenericGBQException
Archives
- Today
- Total
데이터과학 삼학년
ROC, Precision-Recall Curve for Multi classification 본문
반응형
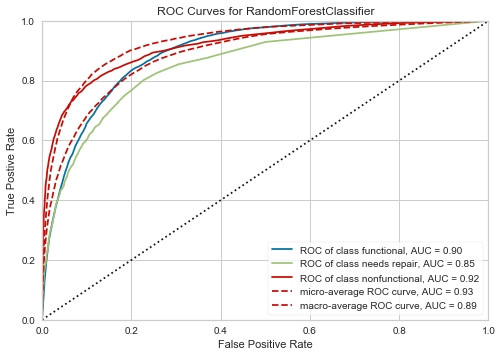
ROC Curve
- multiclassification 문제에서는 각 label별 ROC커브를 그림
import numpy as np
import tensorflow as tf
from sklearn.metrics import precision_recall_curve, auc
import matplotlib.pyplot as plt


from sklearn.preprocessing import OneHotEncoder

# Assuming y_test is a 1D array of class labels
y_test = y_test.values.reshape(-1, 1)
# Create the one-hot encoder
encoder = OneHotEncoder(sparse=False, categories='auto')
# Fit and transform the data
y_test_onehot = encoder.fit_transform(y_test)

num_classes = 3

# Compute ROC curve and ROC area for each class
fpr = dict()
tpr = dict()
thresholds= dict()
roc_auc = dict()

for i in range(num_classes):  # num_classes is the number of classes in your data
    fpr[i], tpr[i], thresholds[i] = roc_curve(y_test_onehot[:, i], y_pred_proba[:, i])
    roc_auc[i] = auc(fpr[i], tpr[i])

# Compute micro-average ROC curve and ROC area
fpr["micro"], tpr["micro"], thresholds["micro"] = roc_curve(y_test_onehot.ravel(), y_pred_proba.ravel())
roc_auc["micro"] = auc(fpr["micro"], tpr["micro"])

# Plot ROC curve for each class
plt.figure(figsize=(10, 8))
colors =  ['red', 'green', 'gray']
for i, color in zip(range(num_classes), colors):
    optimal_idx = np.argmax(tpr[i] - fpr[i])
    plt.plot(fpr[i], tpr[i], color=color, lw=2, label=f'Class {i} (AUC = {roc_auc[i]:.2f}), threshold={thresholds[i][optimal_idx]:.2f}')
    plt.scatter(fpr[i][optimal_idx], tpr[i][optimal_idx], marker='+', s=200, color='blue')

# Plot micro-average ROC curve
plt.plot(fpr["micro"], tpr["micro"], color='gold', label=f'Micro-average (AUC = {roc_auc["micro"]:.2f})', linestyle='--', linewidth=2)

plt.plot([0, 1], [0, 1], 'k--', linewidth=2)  # Plot the random curve
plt.xlabel('False Positive Rate')
plt.ylabel('True Positive Rate')
plt.title('Receiver Operating Characteristic (ROC) Curve')
plt.legend(loc='lower right')
plt.show()
Precision-Recall curve
- precision과 recall의 trade off 고려
precision = dict()
recall = dict()
average_precision = dict()
# Calculate precision-recall curve for each class
for i in range(n_classes):
precision[i], recall[i], _ = precision_recall_curve(y_test_onehot[:, i], y_pred_proba[:, i])
average_precision[i] = auc(recall[i], precision[i])
# Compute micro-average precision-recall curve
precision["micro"], recall["micro"], _ = precision_recall_curve(y_test_onehot.ravel(), y_pred_proba.ravel())
average_precision["micro"] = auc(recall["micro"], precision["micro"])
# Plot Precision-Recall curve for each class
plt.figure(figsize=(10, 8))
colors = ['red', 'green', 'gray']
for i, color in zip(range(n_classes), colors):
plt.plot(recall[i], precision[i], color=color, lw=2,
label=f"Class {i} ")
plt.plot(recall["micro"], precision["micro"], color='gold', lw=2,
linestyle='--',
label=f"Micro-average Precision-Recall curve ")
plt.xlabel('Recall')
plt.ylabel('Precision')
plt.title('Precision-Recall Curve for Multi-Class Classification')
plt.legend(loc="lower right")
plt.show()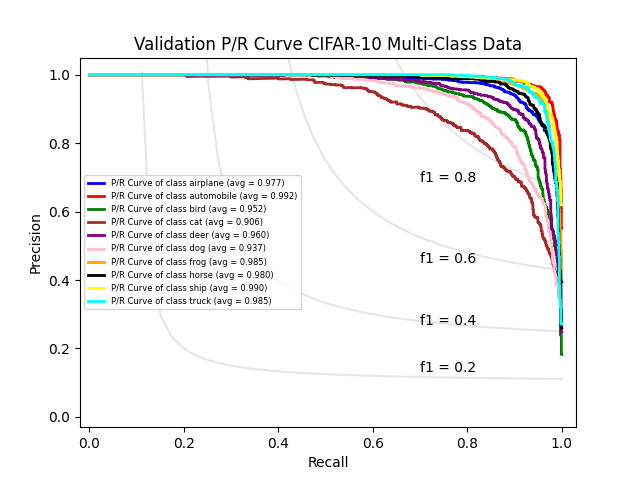
최적의 Threshold
import numpy as np
from sklearn.metrics import plot_roc_curve

# calculate roc curves
fpr, tpr, thresholds = roc_curve(y_test, y_prob2)

#Youden’s J statistic. / J = Sensitivity + Specificity – 1
J = tpr - fpr
optimal_index = np.argmax(J)
best_threshold = thresholds[optimal_index]
728x90
반응형
LIST
'Machine Learning' 카테고리의 다른 글
| [sklearn in spark] spark분산환경을 이용한 모델 예측 (0) | 2024.03.07 |
|---|---|
| [scikit-learn] 카테고리 변수 embedding endcoder 적용 (2) | 2024.02.29 |
| Inductive Learning vs Transductive Learning (1) | 2024.02.09 |
| 다중공선성 확인 및 처리 방법 (0) | 2023.11.06 |
| EBM(Explainable Boosting Machine) (0) | 2023.09.18 |
'Machine Learning' Related Articles
more


Comments