
250x250
반응형
Notice
Recent Posts
Recent Comments
Link
| 일 | 월 | 화 | 수 | 목 | 금 | 토 |
|---|---|---|---|---|---|---|
| 1 | 2 | 3 | 4 | |||
| 5 | 6 | 7 | 8 | 9 | 10 | 11 |
| 12 | 13 | 14 | 15 | 16 | 17 | 18 |
| 19 | 20 | 21 | 22 | 23 | 24 | 25 |
| 26 | 27 | 28 | 29 | 30 | 31 |
Tags
- XAI
- top_k
- requests
- correlation
- Counterfactual Explanations
- API Gateway
- Retry
- session 유지
- 상관관계
- integrated gradient
- youtube data
- 공분산
- GenericGBQException
- UDF
- chatGPT
- TensorFlow
- login crawling
- gather_nd
- hadoop
- 유튜브 API
- spark udf
- grad-cam
- Airflow
- BigQuery
- tensorflow text
- airflow subdag
- subdag
- API
- flask
- GCP
Archives
- Today
- Total
데이터과학 삼학년
Prophet for python (feat. fbprophet) 본문
반응형
Prophet python 튜토리얼
In [1]:
# !pip install fbprophet
Prophet for python
- prophet은 sklearn api 모델을 따름
- 즉, instance를 만들고 fit 과 predict를 이용하는 방식
- input은 항상 ds와 y를 받음
- ds : datestamp YYYY-MM-DD for a date or YYYY-MM-DD HH:MM:SS
- y : numeric한 값 (측정)
In [2]:
import pandas as pd
from fbprophet import Prophet
In [3]:
df = pd.read_csv("prophet_practice.csv") # wikipeia 페이지 뷰 로그 수 데이터
In [4]:
print('df shape:',df.shape)
df.head()
Out[4]:
In [5]:
df.tail()
Out[5]:
- Prophet object를 인스턴스화함
- fit 메서드를 호출하여 데이터 프레임을 전달소요시간(1 ~5초)
In [6]:
m = Prophet()
m.fit(df)
Out[6]:
- 예측이 이루어질 ds날짜가 포함 된 열이있는 데이터 프레임에서 예측이 이루어짐
- 지정된 날짜 수만큼 미래로 확장되는 적절한 데이터 프레임을 얻을 수 있음
- Prophet.make_future_dataframe --> 기본적으로 기록의 날짜도 포함되므로 모델이 맞는지 확인 가능
In [7]:
future = m.make_future_dataframe(periods=365)
future.tail()
Out[7]:
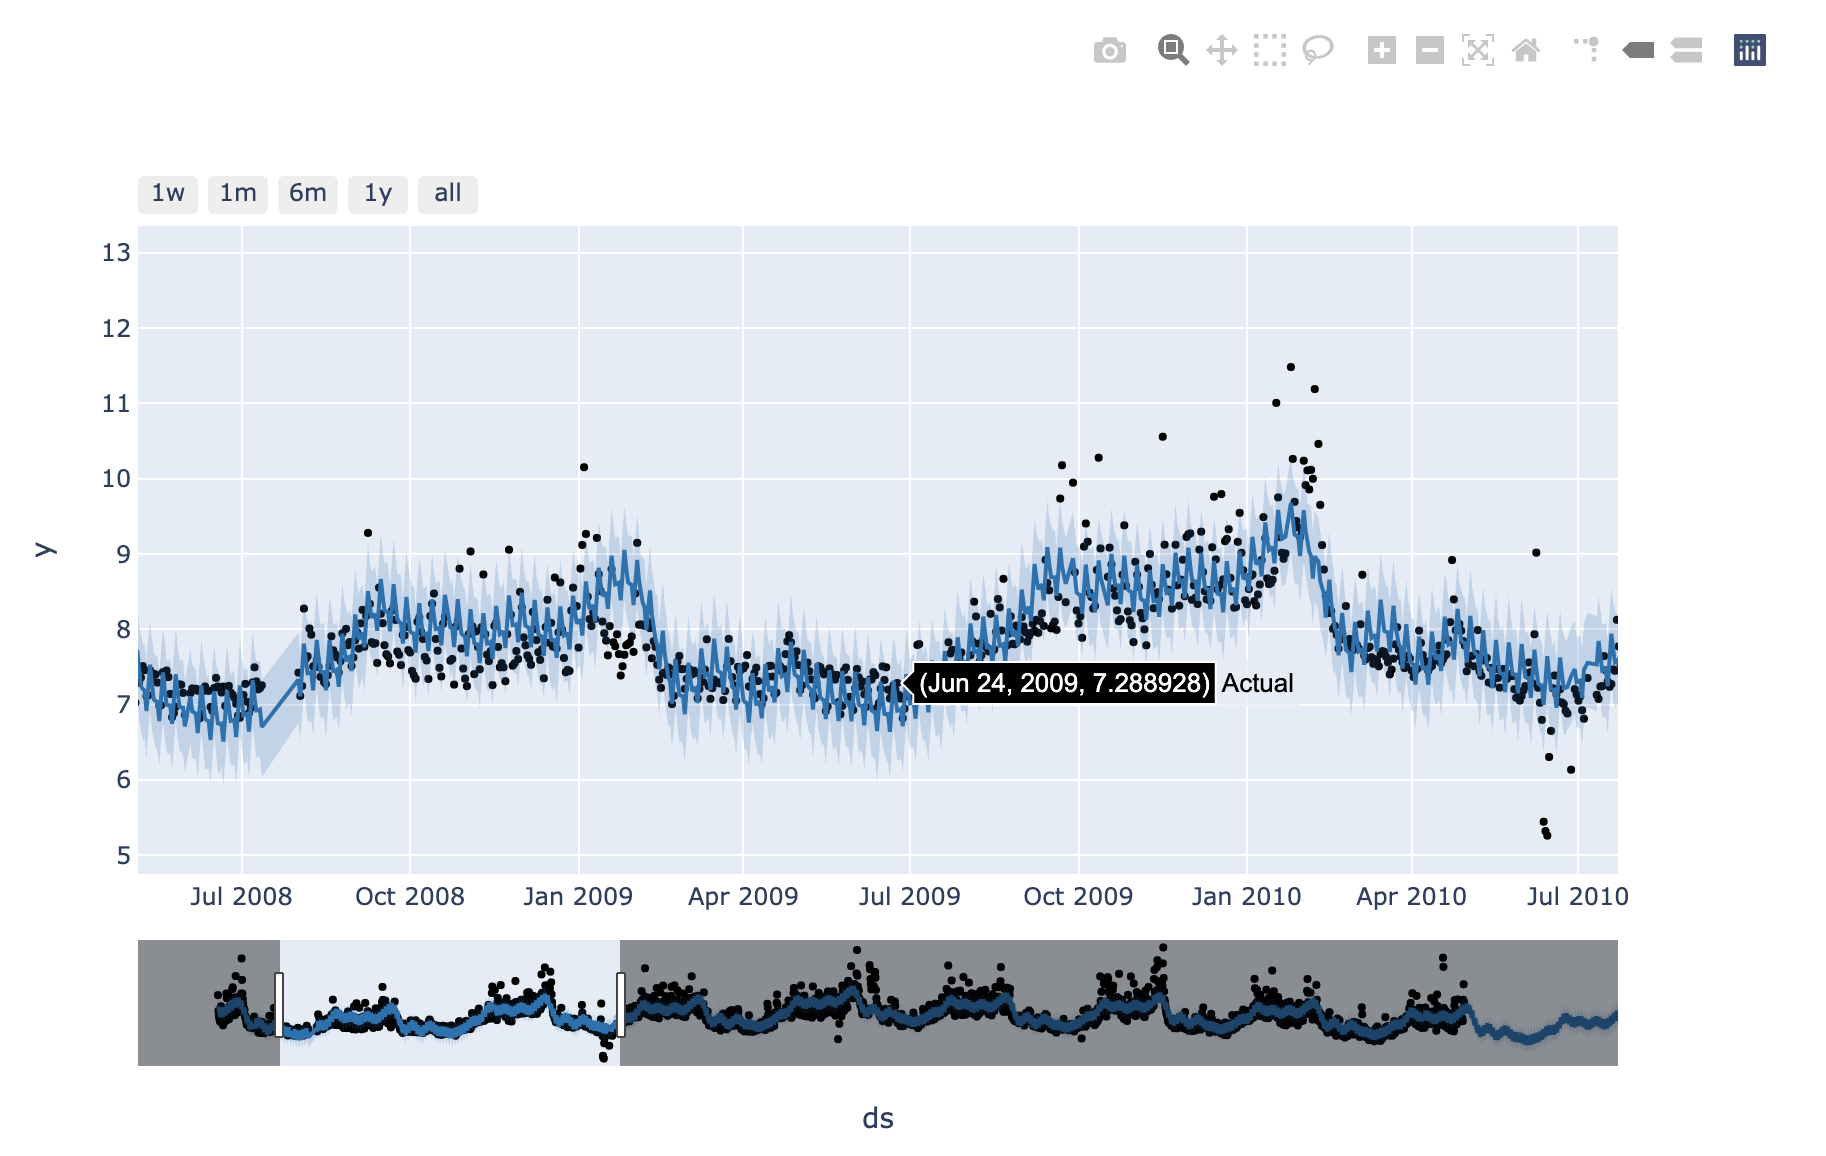
- predict를 이용한 값은 예측값뿐만 아니라, 얘측의 범위(upper, lower)도 추출
In [8]:
forecast = m.predict(future)
forecast[['ds', 'yhat', 'yhat_lower', 'yhat_upper']].tail()
Out[8]:
- plot method를 이용하여 plotting 가능
In [9]:
fig1 = m.plot(forecast)

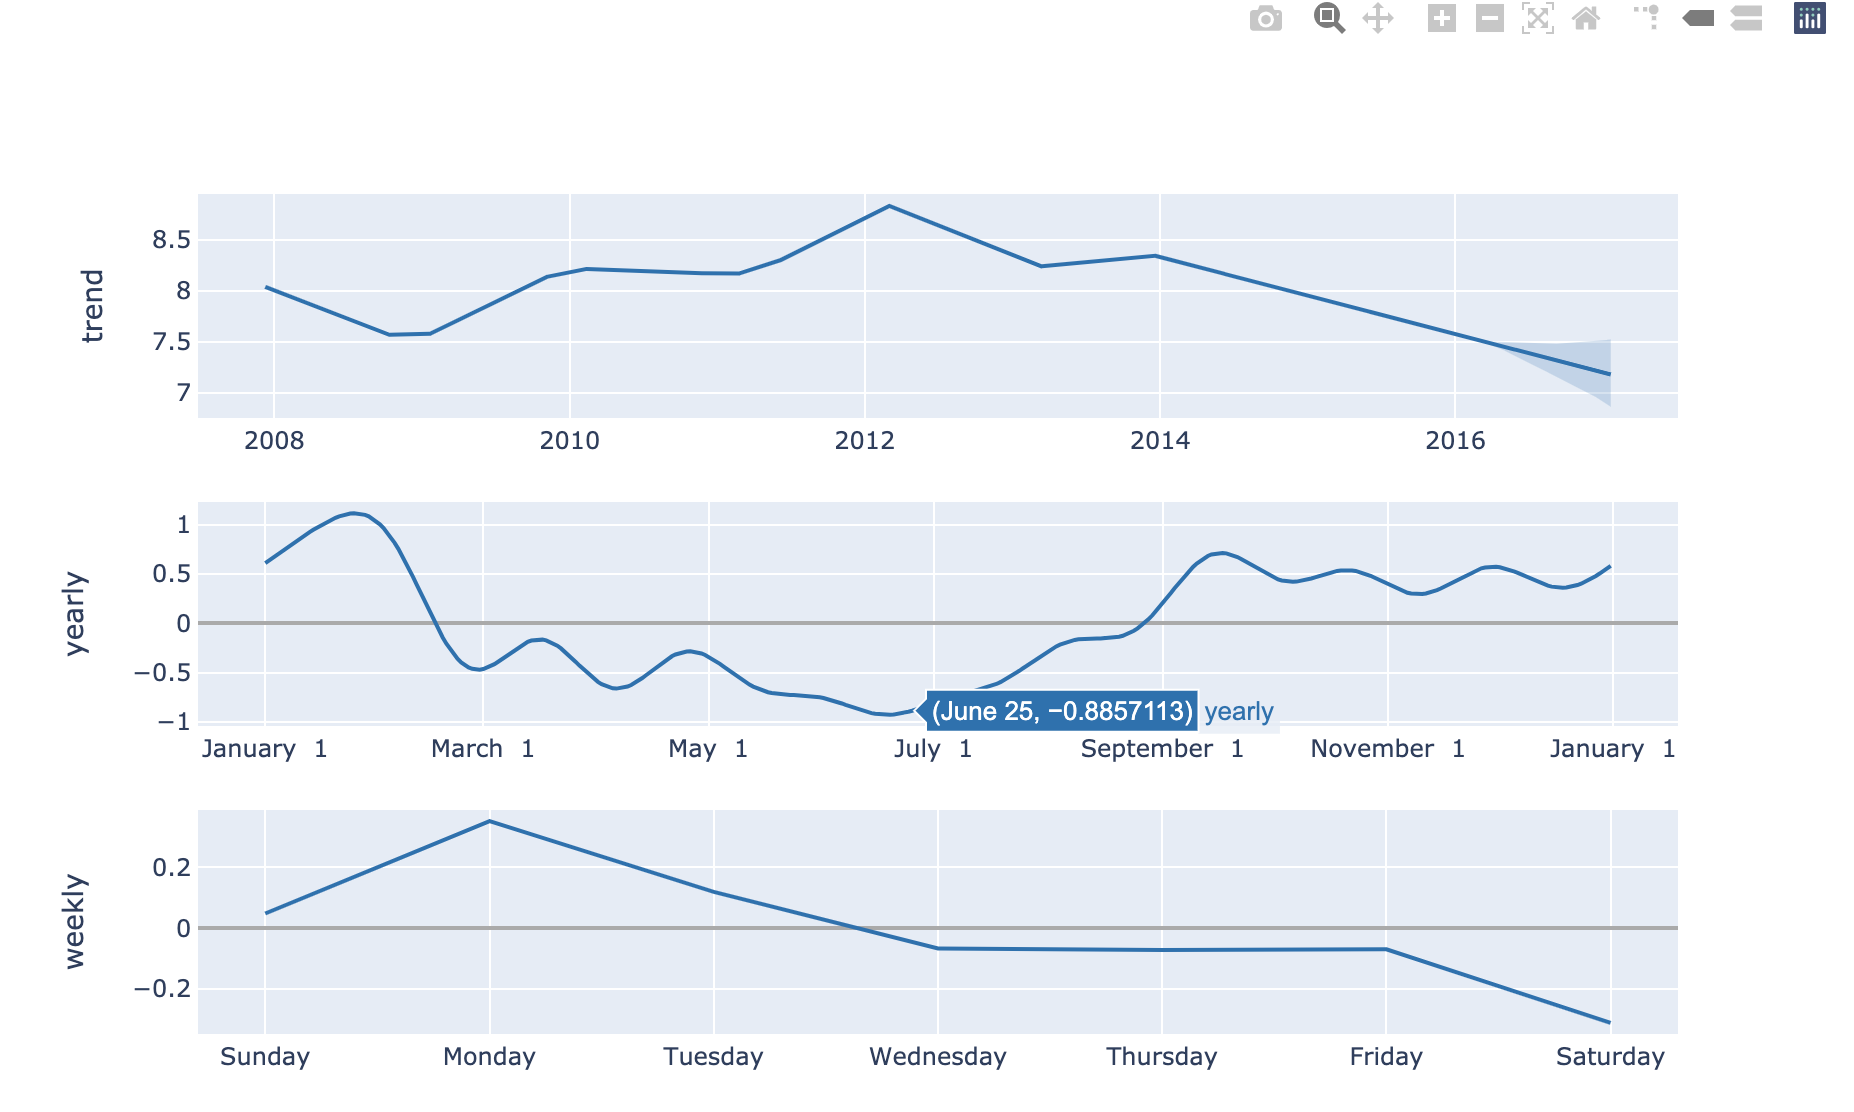
- forecast 요소들을 확인하기 위해서는 Prophet.plot_components 를 사용가능
- default 값으로 trend, seasonality(yearly), weekly seasonality 확인 가능
- holiday를 포함되면 그것 역시 볼수 있음
In [10]:
fig2 = m.plot_components(forecast)

- interactive figure 로도 확인 가능
- plotly 기반으로 구현되어 있기에 해당 라이브러리 설치 필요 (ipywidgets도 필요)
In [11]:
from fbprophet.plot import plot_plotly, plot_components_plotly

plot_plotly(m, forecast)
In [12]:
plot_components_plotly(m, forecast)
prophet_practice.csv
0.08MB
prophet_practice.html
4.71MB
prophet_practice.ipynb
0.01MB
728x90
반응형
LIST
'Time Series Analysis' 카테고리의 다른 글
| [RPs] 시계열 데이터 이미지화 (0) | 2021.01.04 |
|---|---|
| Recurrence Plot (feat. pyts - Imaging time series) (0) | 2020.12.18 |
| Augmented Dickey-Fuller test - 정상성 시계열 데이터 확인 방법 (0) | 2020.11.03 |
| 정상성과 차분 (stationarity & differencing) (0) | 2020.11.03 |
| Recurrence plots (시계열 데이터 이미지화 Time-Series Image) (0) | 2020.10.20 |
'Time Series Analysis' Related Articles
more


Comments