
250x250
반응형
Notice
Recent Posts
Recent Comments
Link
| 일 | 월 | 화 | 수 | 목 | 금 | 토 |
|---|---|---|---|---|---|---|
| 1 | 2 | 3 | 4 | |||
| 5 | 6 | 7 | 8 | 9 | 10 | 11 |
| 12 | 13 | 14 | 15 | 16 | 17 | 18 |
| 19 | 20 | 21 | 22 | 23 | 24 | 25 |
| 26 | 27 | 28 | 29 | 30 | 31 |
Tags
- gather_nd
- flask
- GenericGBQException
- XAI
- spark udf
- API Gateway
- session 유지
- Airflow
- login crawling
- hadoop
- API
- 유튜브 API
- integrated gradient
- BigQuery
- UDF
- correlation
- Counterfactual Explanations
- subdag
- grad-cam
- requests
- 상관관계
- tensorflow text
- GCP
- Retry
- top_k
- TensorFlow
- youtube data
- airflow subdag
- chatGPT
- 공분산
Archives
- Today
- Total
데이터과학 삼학년
Visualize figure using html form data on same web page 본문
반응형
한 페이지에서 parameter를 입력받아 동일 페이지 내에 figure를 출력해보자.
이거...생각보다 어렵다...
일단 post를 하는 방법 부터...공부해야한..다...
코드부터 보자.
일단 나는 timeseries 분석을 위해서
original, trend, seasonal, resid 데이터를 한 화면에 출력하려 한다.
1. app.py 파일 만들기
from flask import Flask, render_template, request, redirect,url_for
import pandas as pd

from bokeh.embed import components
from bokeh.plotting import figure
from bokeh.resources import INLINE
from bokeh.util.string import encode_utf8
from bokeh.models import ColumnDataSource
from bokeh.layouts import row, column, gridplot

## data 불러오기
## 빅쿼리에서 부터 불러와도 되고 로컬에서 불러와도 된다
예제이므로 일단 로컬에서 불러오는 것으로 테스트

window_df = pd.read_csv('window.csv')
decom_df  = pd.read_csv('decom.csv')

### setting data for making figure ###
def setting_df(df):
    df = df.set_index('regdatetime')
    df.index = pd.to_datetime(df.index)
    df.index.name = 'Datetime'
    df.sort_index(inplace=True)
    return df

window_df = setting_df(window_df)
decom_df = setting_df(decom_df)


### input list making ###
worldno_lst = sorted(list(set(window_df.worldno.values)))
print(worldno_lst)
feature_lst = sorted(list(window_df))

위 코드는 Web에 출려할때 리스트 인풋을 받기위해서 정보를 저장해 놓는 용도


### Making Web for visualizaiont using Flask
app = Flask(__name__)

@app.route('/hello')
def hello():
    return 'Hello guys'


def create_figure(worldno,feature):
    window_df['part'] ='window'
    window_df['origin'] = window_df[window_df.worldno==int(worldno)][feature]
    decom_df['resid'] = decom_df[(decom_df.worldno==int(worldno)) & (decom_df.part=='resid')][feature]
    decom_df['trend'] = decom_df[(decom_df.worldno==int(worldno)) & (decom_df.part=='trend')][feature]
    decom_df['seasonal'] = decom_df[(decom_df.worldno==int(worldno)) & (decom_df.part=='seasonal')][feature]
    df = pd.concat([window_df,decom_df],axis=0)
    source = ColumnDataSource(df)
    fig_lst = []
    for i in ['origin','trend','seasonal','resid'] :
        fig = figure(x_axis_type="datetime")
        fig.line('Datetime',i, source=source)
        fig.title.text = '{}_{}_{}'.format(worldno, feature,i.upper())
        fig.xaxis.axis_label = 'TimeStamp'
        fig.yaxis.axis_label = 'Values'
        fig_lst.append(fig)

    grid = gridplot(fig_lst, ncols=1, plot_width=1400, plot_height=200)

    return grid

@app.route('/', methods=['GET', 'POST'])
def index():
    if request.method =='POST':
        worldno = request.form['worldno']
        feature = request.form['feature']
    else:
        worldno,feature = worldno_lst[0], feature_lst[0]

    plot = create_figure(worldno,feature)
    script,div = components(plot)

    js_resources = INLINE.render_js()
    css_resources = INLINE.render_css()

    html = render_template("input.html",
                           plot_script=script,
                           plot_div=div,
                           worldno=worldno,
                           feature=feature,
                           js_resources=js_resources,
                           css_resources=css_resources,
                           worldno_lst=worldno_lst,
                           feature_lst=feature_lst
                    )
    return encode_utf8(html)


if __name__ == '__main__':
    app.run(host='0.0.0.0',debug=True,port=5000)
2. input.html 파일은 요것
<!DOCTYPE html>
<html>
<head>
{{ js_resources|indent(4)|safe }}
{{ css_resources|indent(4)|safe }}
{{ plot_script|indent(4)|safe }}
</head>
<body>
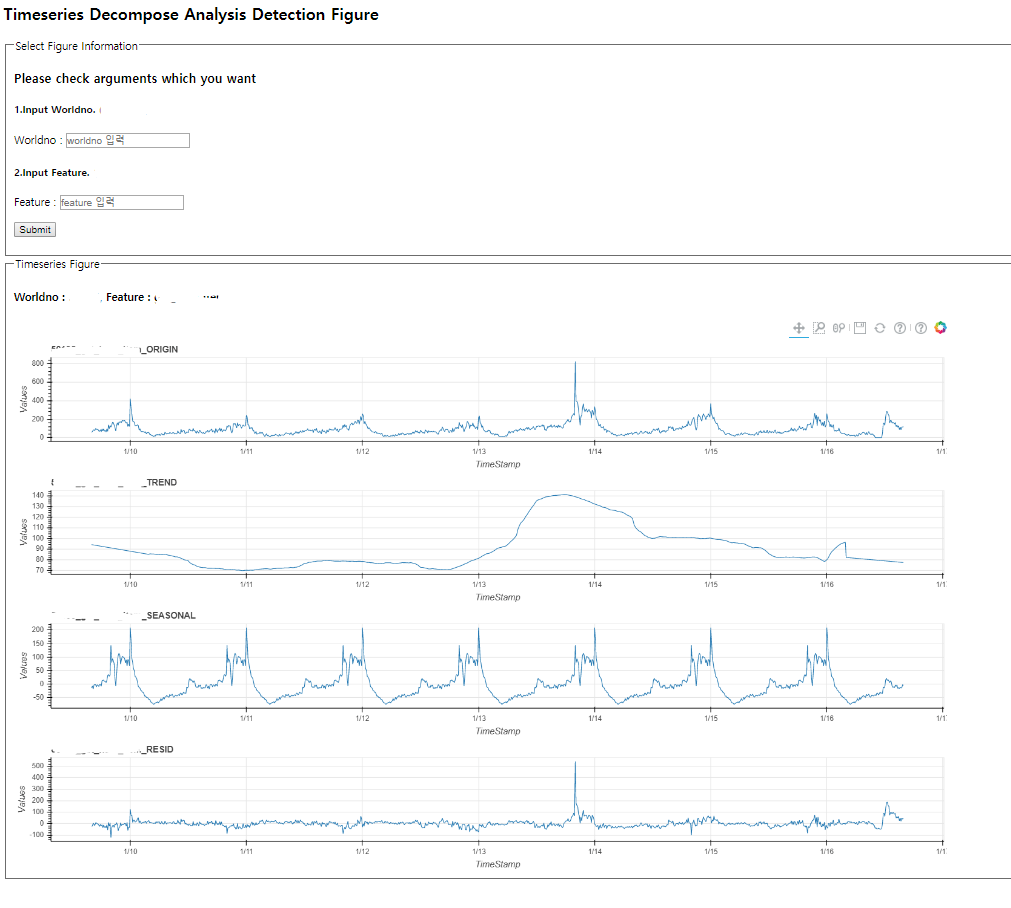
<h2> Timeseries Decompose Analysis Detection Figure </h2>
<form method="POST" action="/">
<p> 위 코드는 동일한 page에 POST로 DATA를 전달한다는 의미 </p>
<fieldset>
<legend>Select Figure Information</legend>
<p>
<h3> Please check arguments which you want </h3>
<h5> 1.Input Worldno </h5>
<label> Worldno : </label>
<input list="worldno_lst" placeholder="worldno 입력" name="worldno" />
<datalist id="worldno_lst">
{% for num in worldno_lst %}
<option value= {{ num }} >
{% endfor %}
</datalist>
<h5> 2.Input Feature </h5>
<label> Feature : </label>
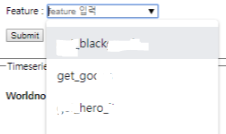
<input list="feature_lst" placeholder="feature 입력" name="feature" />
<datalist id="feature_lst">
{% for num in feature_lst %}
<option value= {{ num }} >
{% endfor %}
</datalist>
<p>
<button type="submit"> Submit </button>
</p>
</fieldset>
</form>
<fieldset>
<legend> Timeseries Figure </legend>
<h4> Worldno : {{ worldno }}, Feature : {{ feature }} </h4>
{{ plot_div|indent(4)|safe }}
{{ div|safe }}
</fieldset>
</body>
</html>ㅋㅋㅋㅋ
html에서 <field
마무으리..
이렇게 해서 app.py를 실행 시키면...
이런 web 화면을 얻을 수 있다.
웹에서 파라미터를 입력하는 부분을 클릭하면 리스트 형태로 나온다!!!
후...
이런식으로 Data scientist 라면 필요에 따라 시각화 툴이 여의치 않을 때에는 입맛에 맞게 만들면 좋을듯 하다.
다음으로..Dashboard 기능을 넣는 것을...트라이...맨~~....
Web 개발 경험이 전혀없고, flask와 html 문법조차 몰랐던 내가..2일 만에 만든 결과라...조금 허술하긴 하다.
728x90
반응형
LIST
'Web' 카테고리의 다른 글
| main HTML 안에 여러 html을 넣는 방식 (0) | 2020.01.23 |
|---|---|
| Pandas dataframe to ajax datatables (0) | 2020.01.21 |
| Visualization tool - bokeh (feat.falsk) (0) | 2020.01.15 |
| HTTP 응답코드와 메소드 정리 (0) | 2020.01.15 |
| pass data(arguments) from html to app.py (feat.flask) (0) | 2020.01.14 |
'Web' Related Articles
more


Comments